A main objective of any research program on igneous rocks is to describe and display chemical variations for simplicity and to facilitate condensing information. The best way to simplify and condense analytical data is by graphical means.
Harker Diagrams
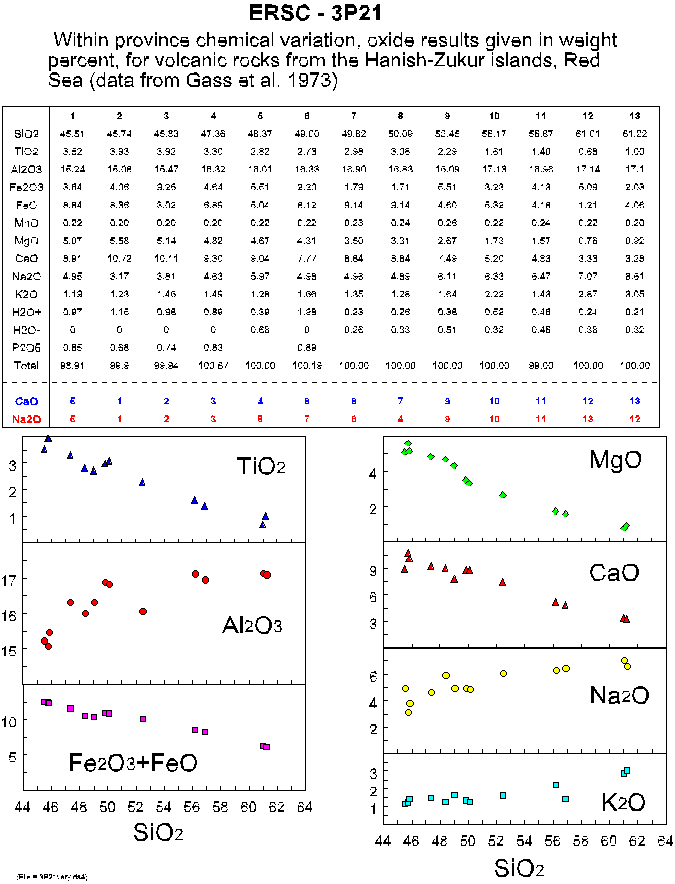
The oldest method is the variation diagram or Harker diagram which dates from 1909, and plots oxides of elements against SiO2.
The table presented at the top half of the handout presents chemical data for a suite of volcanic rocks, from a single volcano, located in the Red Sea area. The results are listed, from 1 to 13, by increasing SiO2 content - with the actual SiO2 contents varying from 45.5 wt % to 61.22 wt%.
With increasing Silica the following trends are evident:
TiO2, FeO, MgO and CaO decrease in abundance
K2O and Na2O increase
Al2O3 does not exhibit a strong variation.
The graphs at the bottom of the handout visually present the data for the same suite of rocks and again exhibit the same relationships (Harker diagrams).
Any element or oxide which exhibits a wide variation in abundance may be chosen as the abscissa (X axis) resulting in a similar set of diagrams, however individual analysis would not appear in the same sequence on each diagram.
At the bottom of the handout the sequence for listing the samples by 1) decreasing CaO and 2) increasing Na2O is shown.
SiO2 is generally chosen because it is the most abundant oxide in igneous rocks and exhibits a wide variation in composition. This type of graphical presentation is useful for large quantities of analytical data and yields an approximation of inter-element variations for a group of samples.
No genetic link can be inferred from Harker diagrams, i.e. that the lowest SiO2 content present on the diagram represents the original or first liquid, for the group of samples presented, from which all other liquids were derived.
Fractionation Indices
To obtain a genetic link between analyses of a given suite of samples fractionation indices were developed. These indices attempt to the results of chemical analyses from an individual igneous suite into their correct evolutionary order. These indices are not realistic but several come close to such an order.
MgO Index
This is used for basaltic rocks. Positive correlations are produced for Na2O, K2O, and P2O5 indicating enrichment in these oxides with successive liquids. Negative correlations result for CaO.
Mg-Fe Ratios
Again used for basaltic rocks. These involve a ratio of Mg to Fe:
MgO/MgO+FeO (ferrous)
MgO/MgO+FeO+Fe2O3 (ferric)
Mg/Mg+Fe (uses atomic proportions of the cations).
Normative Ab/Ab+An
Based on the values of Na2O and CaO. Only good for rocks which crystallize plagioclase, not effected by mafic mineral formation. Generally applied to granites.
The above three indices are only good for specific lithologies, and thus have a restricted application.
Two fractionation indices, based on complex equations have been suggested for more comprehensive use.
Solidification Index (Kuno, 1959)
SI = 100 MgO/(MgO+FeO+Fe2O3+Na2O+K2O)
For basalts this is similar to Mg/Fe ratios due to the relatively poor alkali content. As fractionation progresses the residual liquids become enriched in alkaliis, thus Na2O and K2O contents offset the Mg-Fe index. For mafic rocks SI is high, for felsic rocks SI is low.
Differentiation Index (Thornton and tuttle, 1960)
DI = normative Q+Or+Ab+Ne+Ks+Lc
This is based on the normative analyis results. For mafic rocks DI will be low, because in normative calculation these minerals are minor. Felsic rocks DI will be high because these minerals are abundant in the norm.
Triangular Variation Diagrams
These diagrams visually present the variation in 3 chemical parameters. Two are commonly used:
AFM - Mainly for Mafic Rocks
A = Na2O + K2O
F = FeO (+Fe2O3)
M = MgO
Plotted as either molecular or weight percent values.
Na2O - K2O - CaO - Mainly for Felsic Rocks
Uses either the molecular or weight percent values for the three oxides listed.
Data may be plotted as weight percent oxide or atomic percent of the cations. The disadvantage to this is that the absolute values of the analyses are not readliy determined.